The number of surveillance cameras has increased tremendously since the first closed-circuit television (CCTV) system was developed in 1927. Currently, it is estimated that there are over one billion CCTV cameras around the world.
Without a doubt, these surveillance cameras come with some benefits. For example, they help to mitigate traffic, monitor industrial operations, and prevent crimes.
The advancement in technology has boosted the proliferation of CCTV cameras. These cameras are becoming powerful and cheaper. With the internet, you can access live videos remotely, pass them around or even store them in the clouds. There has also been a rise in the adoption of facial recognition technology in video surveillance.
Some people argue that the increasingly widespread capabilities of CCTV cameras can make society safer and efficient. On the other hand, others see it as an encroachment on the right to privacy. We, at PrivacySavvy.com, are on the second side.
Regardless of which side you stand on, the fact is video surveillance is increasing worldwide.
Many cities across the world are under heavy CCTV surveillance, according to a new PrivacySavvy analysis. Our research found China’s Taiyuan to be leading the pack here, but UK’s London and India’s Hyderabad are installing CCTVs at a pace.
PrivacySavvy researchers relied on various sources, including police websites, news articles, government reports, and other internet sources for data. We tried as much as possible only to include public CCTV cameras.
Here are some of the critical statistics at a glance for you that we found out:
- China has 56% of all CCTV cameras in the world
- 18 of the top 20 most surveilled cities are in China
- New York has the highest density of CCTV cameras in the US
- London is the 3rd city with the highest number of CCTV cameras
- More CCTV cameras do not translate to less crime and more safety
- Hyderabad has the highest density of CCTV cameras in India
- Taiyuan has more cameras per 1000 people than any city in the world
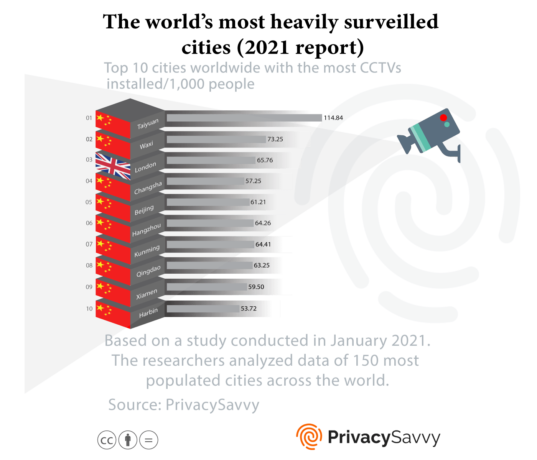
The 20 most surveilled cities in the world
These are the most surveilled cities in the world based on the number of cameras per 1,000 people:
| City | Country | Number of CCTVs | Number of people | CCTVs per 1000 people |
| Taiyuan | China | 482,256 | 4,199,289 | 114.84 |
| Wuxi | China | 312,531 | 4,266,320 | 73.25 |
| London | England (UK) | 631,627 | 9,604,956 | 65.76 |
| Changsha | China | 285,000 | 4,977,713 | 57.25 |
| Beijing | China | 1,310,213 | 21,402,910 | 61.21 |
| Hangzhou | China | 510,414 | 7,942,140 | 64.26 |
| Kunming | China | 312,000 | 4,843,276 | 64.41 |
| Qingdao | China | 374,426 | 5,919,277 | 63.25 |
| Xiamen | China | 221,345 | 4,120,191 | 59.50 |
| Harbin | China | 310,000 | 6,687,145 | 53.72 |
| Suzhou | China | 350,000 | 7,669,092 | 45.63 |
| Shanghai | China | 1,126,221 | 27,958,431 | 40.28 |
| Urumqi | China | 215,489 | 4,868,872 | 44.25 |
| Chengdu | China | 399,000 | 10,235,761 | 38.98 |
| Shenzhen | China | 515,000 | 13,456,820 | 38.27 |
| Hyderabad | India | 356,221 | 10,994,044 | 32.40 |
| Jinan | China | 250,000 | 5,660,585 | 44.16 |
| Shenyang | China | 324,129 | 7,620,164 | 42.53 |
| Hefei | China | 182,725 | 4,721,574 | 38.70 |
| Tianjin | China | 470,000 | 13,839,056 | 33.96 |
The top 50 most-surveilled cities in the world
| City | Country | CCTV cameras | Population | CCTV cameras/1000 people | Crime index |
| Taiyuan | China | 482,256 | 4,199,289 | 114.84 | 50.57 |
| Wuxi | China | 312,531 | 4,266,320 | 73.25 | 7.84 |
| London | England | 631,627 | 9,604,956 | 65.76 | 53.81 |
| Changsha | China | 285,000 | 4,977,713 | 57.25 | 22.68 |
| Beijing | China | 1,310,213 | 21,402,910 | 61.21 | 33.87 |
| Hangzhou | China | 510,414 | 7,942,140 | 64.26 | 20.21 |
| Kunming | China | 312,000 | 4,843,276 | 64.41 | 30.10 |
| Qingdao | China | 374,426 | 5,919,277 | 63.25 | 8.12 |
| Xiamen | China | 221,345 | 4,120,191 | 59.50 | 17.69 |
| Harbin | China | 310,000 | 6,687,145 | 53.72 | 32.39 |
| Suzhou | China | 350,000 | 7,669,092 | 45.63 | 15.43 |
| Shanghai | China | 1,126,221 | 27,958,431 | 40.28 | 34.32 |
| Urumqi | China | 215,489 | 4,868,872 | 44.25 | 21.85 |
| Chengdu | China | 399,000 | 10,235,761 | 38.98 | 26.53 |
| Shenzhen | China | 515,000 | 13,456,820 | 38.27 | 32.79 |
| Hyderabad | India | 356,221 | 10,994,044 | 32.40 | 42.96 |
| Jinan | China | 250,000 | 5,660,585 | 44.16 | 12.37 |
| Shenyang | China | 324,129 | 7,620,164 | 42.53 | 39.31 |
| Hefei | China | 182,725 | 4,721,574 | 38.70 | 7.11 |
| Tianjin | China | 470,000 | 13,839,056 | 33.96 | 28.82 |
| Chennai | India | 313,483 | 11,901,168 | 26.34 | 41.22 |
| Nanjing | China | 292,597 | 9,347,972 | 31.30 | 13.31 |
| Wuhan | China | 329,983 | 8,864,907 | 37.22 | 24.45 |
| Changchun | China | 264,831 | 4,925,361 | 53.76 | 26.42 |
| Guangzhou | China | 684,579 | 13,701,932 | 49.64 | 39.95 |
| Zhengzhou | China | 364,893 | 5,522,686 | 66.07 | 20.40 |
| Chongqing | China | 336,573 | 16,772,579 | 20.06 | 25.87 |
| Baghdad | Iraq | 189,813 | 7,544,230 | 25.16 | 63.29 |
| Moscow | Russia | 745,491 | 13,137,973 | 56.74 | 38.77 |
| Wenzhou | China | 148,735 | 3,923,846 | 37.90 | 24.91 |
| Dongguan | China | 274,593 | 7,817,652, | 35.12 | 41.34 |
| Singapore | Singapore | 114,731 | 6,435,653 | 17.82 | 31.98 |
| Delhi | India | 968,321 | 31,590,896 | 30.65 | 59.18 |
| Foshan | China | 273,542 | 7,726,812 | 35.40 | 34.49 |
| Shijiazhuang | China | 118,476 | 4,814,193 | 24.60 | 28.21 |
| Sydney | Australia | 210,785 | 5,225,937 | 40.33 | 32.67 |
| St. Petersburg | Russia | 389,149 | 5,687,818 | 68.41 | 41.25 |
| Nanchang | China | 89,674 | 3,894,921 | 23.02 | 21.94 |
| Nanning | China | 98,561 | 3,957,678 | 24.90 | 19.51 |
| Lanzhou | China | 62,275 | 3,780,822 | 16.47 | 28.27 |
| Xinbei (New Taipei City) | Taiwan | 84,338 | 5,198,283 | 16.22 | 20.24 |
| Istanbul | Turkey | 201,649 | 16,190,546 | 12.45 | 41.50 |
| Hong Kong | Hong Kong | 425,114 | 7,647,402 | 55.59 | 21.73 |
| Guiyang | China | 170,577 | 3,918,173 | 43.53 | 39.65 |
| Dalian | China | 132,000 | 6,917,819 | 19.08 | 17.53 |
| Los Angeles | United States | 212,384 | 4,587,640 | 46.29 | 48.41 |
| Xian | China | 435,746 | 8,145,165 | 53.50 | 23.75 |
| Bangkok | Thailand | 132,581 | 11,542,794 | 11.48 | 42.08 |
| Guadalajara | Mexico | 76,943 | 5,211,365 | 14.76 | 61.19 |
| Berlin | Germany | 32,670 | 3,645,000 | 8.96 | 42.14 |
20 most populated cities comparing with the number of CCTV available
The cities that are surveilled the most are not the most populated. In the table below, we look at how the world’s most decadent populated cities compare in terms of camera figure per 1000 people.
| City | Country | Number of CCTV cameras | Population | CCTVs/1000 people |
| Tokyo | Japan | 129,409 | 37,393,129 | 3.04 |
| Delhi | India | 1,084,873 | 30,290,396 | 35.81 |
| Shanghai | China | 1,126,221 | 27,058,480 | 41.62 |
| São Paulo | Brazil | 10,593 | 22,043,028 | 0.48 |
| Mexico City | Mexico | 99,254 | 21,782,378 | 4.55 |
| Dhaka | Bangladesh | 34,527 | 21,005,860 | 0.16 |
| Cairo | Egypt | 6,836 | 20,900,604 | 0.32 |
| Beijing | China | 1,310,213 | 20,462,610 | 65.49 |
| Mumbai | India | 23,498 | 20,411,274 | 1.15 |
| Osaka | Japan | 56,642 | 19,165,340 | 2.95 |
| Karachi | Pakistan | 144,997 | 16,093,786 | 9.00 |
| Chongqing | China | 336,573 | 15,872,179 | 21.20 |
| Istanbul | Turkey | 159,030 | 15,190,336 | 10.47 |
| Buenos Aires | Argentina | 48,694 | 15,153,729 | 3.21 |
| Kolkata | India | 165,588 | 14,850,066 | 11.15 |
| Manila | Philippines | 13,549 | 13,923,452 | 0.97 |
| Tianjin | China | 470,000 | 13,589,078 | 3.45 |
| Rio de Janeiro | Brazil | 24,258 | 13,458,075 | 1.80 |
Correlation between the number of cameras and crime index
There is a common argument that CCTV cameras help to prevent crime. We used Numbeo’s current crime index by city 2021 to compare with CCTV cameras. This is to demonstrate whether there is a relation between the number of cameras and the crime rate.
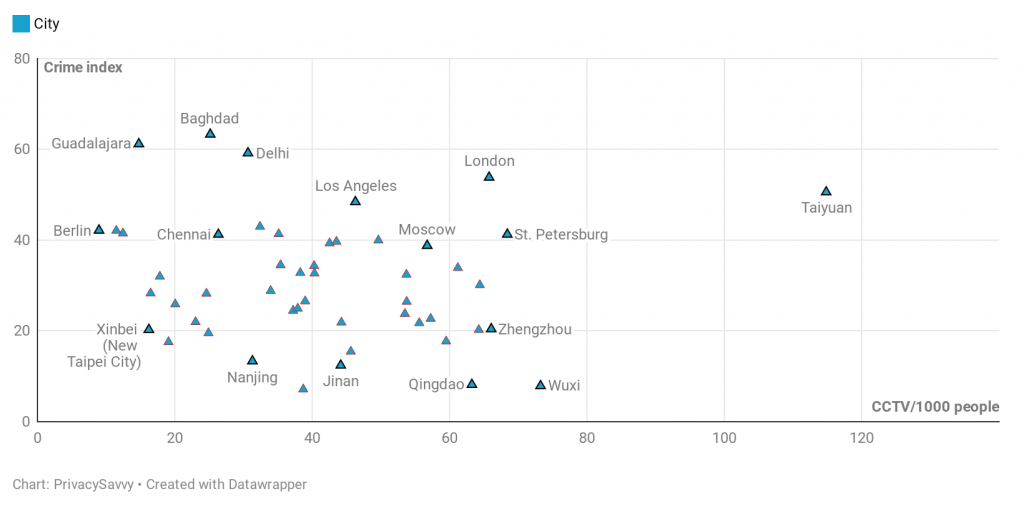
The chart above refutes the claim that CCTV surveillance helps to reduce crime.
Cities with more cameras do not correlate with lower crime rates. In other words, a high number of cameras does not reduce or prevent crime.
Is China the most surveilled nation in the world?
There are conflicting estimates of the actual number of CCTVs in China. However, according to a 2019 report by IHS Markit, nearly 54% of the world’s CCTV cameras are located in the country.
China’s dominance has increased by 2% until now since, as per our research, China now has 56% of all cameras worldwide. There are approximately a billion surveillance cameras globally, so China has more than 500 million cameras. In fact, nine out of ten most surveilled cities are in China.
With a population of 1.4billion people, there is a camera for every three people. It may seem absurd, but knowing how China operates can be a fraction of the real number of active surveillance cameras.
From the data above, Taiyuan, Shanxi province’s largest city, has more than 4,199,289 cameras with a population of 3.9 million people. This translates to one camera for eight residents.
China’s capital city Beijing has a population of around 20 million people, with over 1.15 million installed CCTV cameras. However, it has fewer cameras per capita than Taiyuan.
The Chinese government is also increasingly adopting facial recognition surveillance in most cities across the country. In fact, it is mainly used by the police bureaus and recently used to control the Covid-19 outbreak.
Other major cities around the world are following in the Chinese footsteps. For example, Moscow in Russia has seen an increase in the deployment of facial recognition. In addition, a private operator at the King Cross in London used facial recognition without public consent. However, the program was terminated after a public outcry.
Meanwhile, other countries such as Singapore and Hong Kong are planning to deploy facial recognition technology. Many US cities have barred the technology alluding to privacy concerns. For example, both San Francisco and Boston have banned facial recognition technology by agencies and police.
Freedom vs. security
There are concerns that widespread surveillance infringes the right to privacy. We at PrivacySavvy, are of that opinion, too.
According to the International Covenant on Civil and Political Rights, the collection and use of biometric data should only involve people associated with crime and not the general population.
The Chinese government disregards this international guaranteed right. It is pioneering the usage and exportation of facial recognition technology in major cities across the country.
That is in line with the proposed social points system. The country has a database of 1.3 billion pictures that the CCTVs cameras will match with a face to identify wrongdoing citizens quickly.
Mass urbanization is the main reason for the increased amount of cameras in India. The increased population in cities has led to rising crime and scarcity of urban resources. With a growing economy, there is an emerging middle class that seeks protection with CCTV surveillance.
Methodology
PrivacySavvy researchers used multiple sources to estimate the number of CCTV cameras installed around the world. Moreover, we used World Population Review to get data of the most populated cities but left out those we couldn’t get enough information. We sourced the crime data index from Numbeo.com.
With the data on population and number of CCTV cameras, we were able to calculate the number of cameras per 1000 people.
We mostly included public CCTV cameras. This comprises cameras installed on public transport, on public buildings, and those used by law enforcers. However, it is essential to note that it was difficult to differentiate between public and private CCTV cameras in some instances. So, the number of cameras may also include some private ones.
Moreover, the actual figures may be higher or lower than we have reported. This is because of the multiple sources giving varied estimates and lack of public information about CCTV surveillance.
Nonetheless, we have tried to make our study as fair and accurate as possible by relying only on credible sources. Besides, we went for the lower figure if we got two conflicting sources. Although we have used a few older data sources, we mostly used the latest data available.
There are a few cities we left out in our study due to the lack of sufficient information. They include Alexandria, Pyongyang, Jeddah, Kinshasa, Addis Ababa, Abuja, Dar Es Salaam, and Nagoya.
